
North Carolina Voting Analysis: Winning is All About TURNOUT
The 2018 elections were a major triumph for NC Democrats, who won a majority of statewide votes and finally broke the supermajorities Republicans had held in both chambers of the North Carolina General Assembly (NCGA) since 2012. This was an especially remarkable feat considering North Carolina’s extremely gerrymandered legislative maps (which were finally ruled unconstitutional this past September) and the fact that Republicans typically have a substantial turnout advantage in midterm elections.
As we look ahead to 2020, a key question is how Democrats achieved their success in 2018 – and how to build on that success in 2020. Our analysis provides a resounding answer: The statewide “blue wave” in 2018 was driven overwhelmingly by a sharp increase in turnout among Democratic base voters, and turning out the Democratic base will be the key to winning big in 2020.
To fully appreciate the magnitude of the Democratic turnout surge in 2018, it’s important to note that it was a “blue-moon” election year in North Carolina, meaning there were no statewide federal races at the top of the ticket to bring voters to the polls. These elections happen every 12 years, and, historically, turnout has been very low. In the last blue-moon election year (2006), statewide turnout was just 37%.
Even in normal midterm elections, Republicans typically have a substantial turnout edge; while midterm turnout is never as high as presidential-year turnout, midterm falloff among Democrats is, on average, several points higher than it is among Republicans. In NC’s 2014 elections, for example, 47% of right-leaning voters turned out – compared with just 41% of left-leaning voters.

But that changed in 2018. This past November saw record midterm turnout across the board in NC, but this time left-leaning turnout matched right-leaning turnout at around 53%. For right-leaning voters, that’s a 6-point increase over 2014 midterm turnout; for left-leaning voters, it’s a 12-point increase that changed the composition of those voting and led to a major breakthrough for Democrats.
While many analysts have suggested that the big increases in Democratic margins in places like suburban Mecklenburg and Wake counties have been due to Republican voters turning away from Trump, our analysis reveals that these shifts have been driven almost entirely by changes in who is turning out to vote. Not only has the pool of registered voters become increasingly left-leaning in these suburban/exurban areas, 2018 saw an enormous surge in turnout among sporadic, left-leaning voters (both registered Democrats and Independents). In fact, in the seven competitive NC House districts Democrats flipped in 2018 in suburban Mecklenburg and Wake counties, changes to which voters turned out was alone responsible for a whopping 15-point improvement in the margin for Democrats relative to 2014 and a 6-point improvement relative to 2016.
In contrast, vote switching contributed only about 1 point to the Democratic margin in 2018, both statewide and in the most competitive legislative districts.
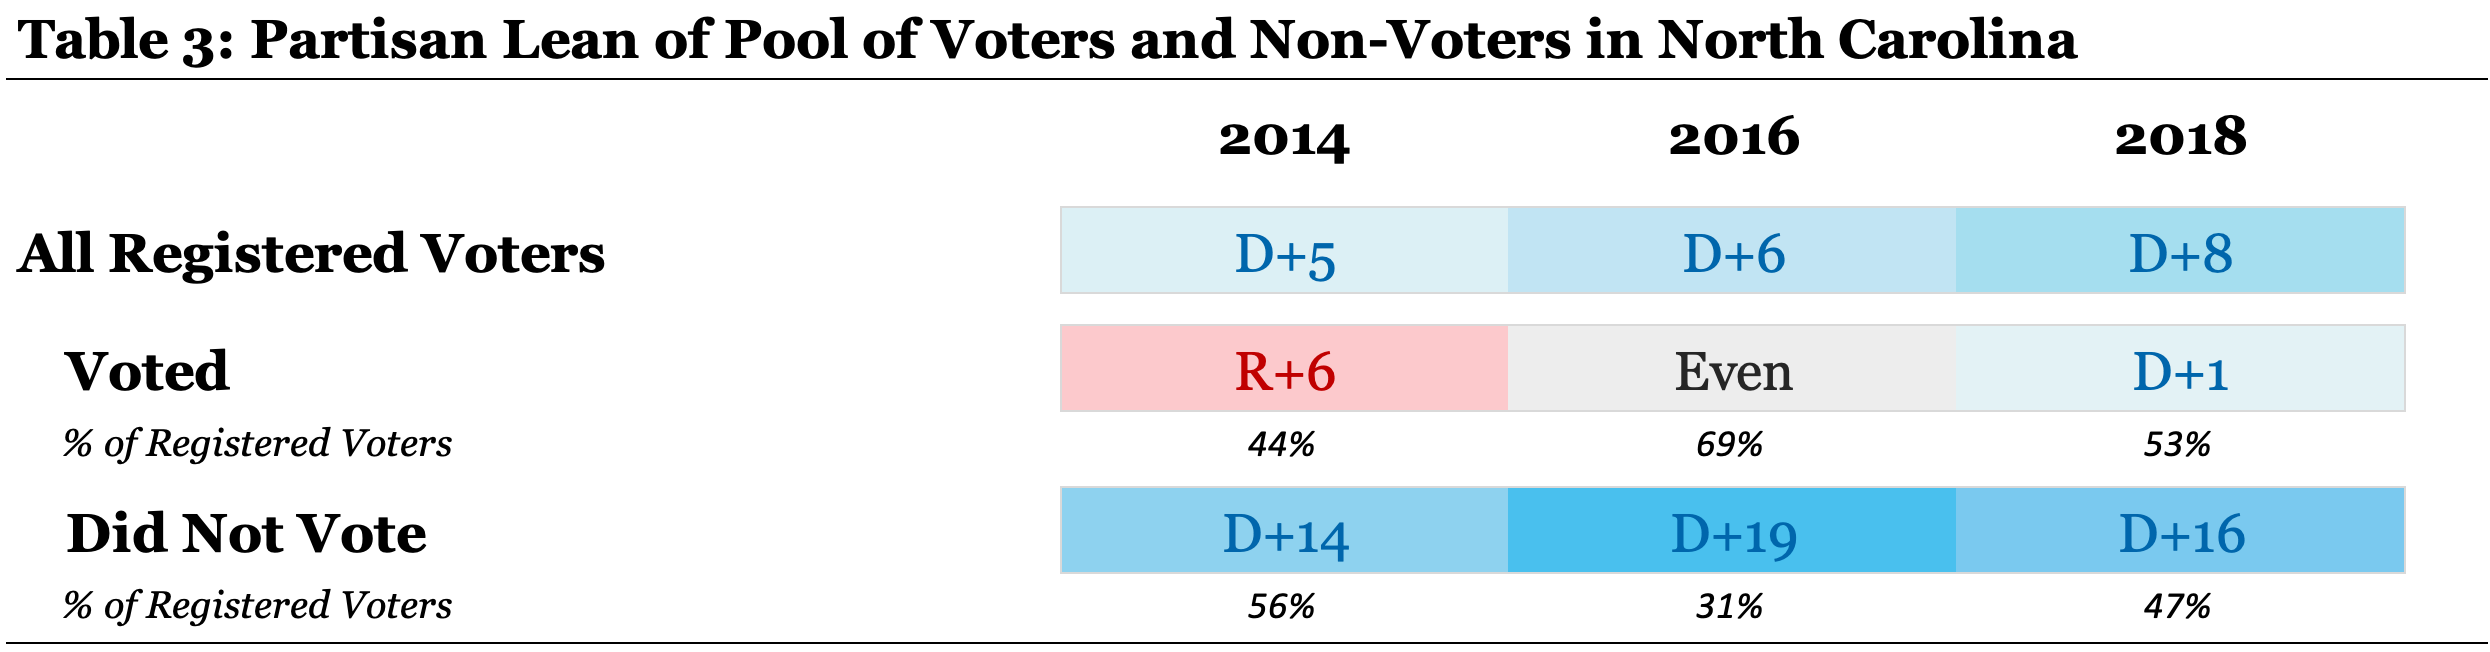
Our analysis also reveals that the pool of registered voters in North Carolina has gotten increasingly left-leaning with each election cycle from 2014 to 2018, going from D+5 to D+8. And the pool of untapped voters (those not voting in recent elections) is even more left-leaning; the registered voters who stayed home in 2016 had a partisan lean of 19 points!
Overall, these findings provide a clear guide for how Democrats can win North Carolina in 2020: it’s all about base turnout. While Republicans have already been maximizing their base-voter turnout, Democrats have an opportunity to tap into an enormous pool of base voters who stayed home in 2016 and 2018. In the current hyper-partisan environment, with interest in the 2020 elections already at an all-time high at this point in the election cycle – and with fewer true swing voters in the electorate than any other point in recent history – Democrats can win big statewide by choosing candidates, policies, and messaging that inspire sporadic base voters to get to the polls.
Overview of Our Analysis
To understand the importance of turnout versus vote switching over the past several elections in North Carolina, we use detailed data from the NC voter file to analyze voter turnout and election results. Our analysis has two main components.
First, we use a statistical model of voting behavior to show how likely a voter is to vote for the Democratic candidate on the basis of the voter’s party, race, ethnicity, sex, education, and geography. The model uses election results data and the composition of voter turnout in each of North Carolina’s 2,700+ precincts for the 2016 and 2018 elections. From this model, we can infer how likely different groups are to vote for the Democratic candidate by examining how precinct-level election results change as different types of voters become a larger or smaller share of turnout in a precinct.
A number of patterns emerge from this analysis. For example, it will not surprise close followers of NC politics that, while almost all registered Democrats in urban areas consistently vote for Democratic candidates, older white registered Democrats in rural areas are significantly more likely to vote Republican than Democratic. Other less obvious (yet equally consistent) patterns emerge from the data that tell us how various subcategories of voters tend to vote, and these findings are key in understanding changes in election outcomes over the past several election cycles.
Our analysis of NC’s 2018 legislative races tracks closely with political scientist Rachel Bitecofer’s highly accurate national analysis of 2018 congressional races and, following on her predictive model, we incorporated college attainment into our statewide turnout model.
The second step of our analysis uses the statistical model to analyze how the composition of the turnout has changed from election to election between 2012 and 2018. For every precinct in the state, we calculate how much the vote margin shifted due to changes in the composition of voters who turned out to vote in that election.
Turnout Analysis – Main Results
Table 1 reports the results of our analysis for NC House districts. The first row shows results for the state as a whole, and the second set of rows shows results for competitive NC House districts.

Statewide
In 2018, Democratic candidates running in contested NC House races earned 51% of the two-party vote share, outperforming Governor Cooper’s 2016 margin by 1.8 points. This improvement is shown in the “Change in Outcome” column of the table. The remaining columns report the predicted changes in results based on changes in the composition of turnout between 2016 to 2018 (presidential-to-midterm comparison). Our model shows that shifts in the composition of turnout were responsible for improving the statewide Democratic margin by 1.2 points relative to 2016.
Competitive NC House Districts
The second set of rows in Table 1 shows outcomes for the most competitive NC House races in 2018. Democratic performance tracked closely with changes in the composition of turnout in all three sets of competitive districts.
Competitive districts that flipped in 2018. In the nine GOP-held competitive districts Democrats flipped in 2018, Democrats improved on Governor Cooper’s performance by 5.9 points. Comparing the change in outcome to the predicted change based only on which voters turned out shows that the vast majority of this improvement – 5.0 points – was due to an enormous increase in left-leaning turnout in these districts.

NC House District 105 (southern Mecklenburg County) is one of the competitive districts that flipped blue in 2018. Changes to the composition of the electorate (i.e., who turned out to vote) fully explain this district’s 5-point swing from 2016 to 2018. This change was driven both by a greater portion of left-leaning voters turning out in 2018 and an increasing pool of registered left-leaning voters in Mecklenburg County. The change in the composition of the electorate is even starker when compared with 2014, the last midterm election.
Competitive districts that did not flip in 2018. In the nine relatively competitive GOP-held districts that Democrats did not flip in 2018, the changes in both turnout and results mirrored the state as a whole. In these districts, Democratic candidates for the NC House improved on Cooper’s 2016 performance by a more modest 1.3 points. This improvement was almost entirely due to changes in turnout, which increased the Dem margin by 1.2 points relative to 2016.

NC House District 51 (Sanford area) is one of the competitive districts that did not flip in 2018. Although the composition of turnout was more left-leaning that in 2014, it was nearly half a point more right-leaning than in 2016. Despite the lack of improvement in left-leaning turnout over 2016, the Democratic candidate over-performed the expected margin by about 4 points, suggesting gains were due to vote switching; however, strong support among swing voters, alone, wasn’t enough to overcome Republicans’ turnout advantage in the district.
Democratic districts held by close margins. In three other districts that Democrats held by relatively close margins in 2018, Democratic House candidates performed about 6 points worse than Governor Cooper. About two-thirds of this change – 4.1 points – was attributable to the changing composition of turnout relative to 2016. Falloff in left-leaning turnout from a presidential election to a midterm year is typical, and the good news for Democrats in these districts is that the composition of turnout was actually 3.8 points better in 2018 compared with the most recent midterm election in 2014 (see midterm comparison, below).
Midterm-to-Midterm comparison
Despite showing strong gains relative to 2016, this presidential-to-midterm comparison masks what were incredible midterm gains for Democrats. Table 2, below, adds a 2014 midterm-to-midterm comparison that shows changes from 2014 to 2018 in the composition of voter turnout improved the Democratic margin by 7.0 points statewide – and an astounding 14.2 points in the districts that flipped in 2018!
This midterm-to-midterm comparison also reveals significant gains relative to 2014 in the competitive districts that did not flip – while showing that there remains significant opportunity to grow base turnout in these areas and flip competitive GOP-held districts in 2020.

Overall, the results of our turnout analysis lead to a clear and unambiguous conclusion: The 2018 blue wave in North Carolina was due almost entirely to a massive surge in sporadic left-leaning voters turning out to vote. Not only was this surge enough to prevent the usual falloff for Democrats in midterm elections, but it helped Democrats significantly overperform Cooper’s numbers in the key districts they flipped in 2018. If Democrats can drive a similar turnout surge in a Presidential election year, they can sweep every statewide race and retake the majority in the NC House.
Untapped Voters
In addition to analyzing the composition of voter turnout, our model of voting behavior allows us to examine the pool of registered voters as a whole and to compare the pool of voters who turned out to those who did not vote in recent elections. Table 3 shows the results of this analysis.
There are a number of important takeaways:
First, the pool of registered voters as a whole is left-leaning and has become increasingly left-leaning over the past several election cycles, growing from D+5 in 2014 to D+8 in 2018.
However, the composition of turnout (those who voted) has been far more even – or even Republican leaning – over the past several election cycles, because right-leaning voters turn out much more consistently than left-leaning voters.
As a result, there is an enormous pool of untapped left-leaning voters for Democrats to turn out in 2020. The pool of registered non-voters had a partisan lean of D+19 in 2016 and D+16 in 2018.
As with our statewide turnout analysis, above, these statewide trends mask significant variation across districts and counties. In the districts that flipped in 2018, the composition of voters who turned out and the composition of registered voters who stayed home look far more similar to each other than in other parts of the state. Across the rest of the state – including key districts that did not flip in 2018 – far more left-leaning voters stayed home.

In southern Mecklenburg County, increased turnout among left-leaning voters narrowed the partisan gap between voters and non-voters to just 5 points in NC-H105, far below the statewide average.

In the Sanford area, the partisan gap between voters and non-voters was 25 points(!) in 2018, leaving a ton of room to improve left-leaning turnout and narrow the partisan gap.
Democrats have a lot to gain from pursuing a base-turnout strategy that taps into the huge pool of low-propensity, left-leaning voters that will be the key to Democratic victories in 2020. Although there is wide variation across the state in turnout among Democratic base voters, Republicans consistently get their base voters to the polls at higher rates. The good news is that that gives the GOP far less room to increase their margins, while Democrats still have significant room to drive up base turnout. The question is: What is the Democratic base, and which Democratic base voters are staying home?
Defining the Democratic base. We use the term “Democratic base voters” to refer to left-leaning registered Democrats and Unaffiliated voters who, if they vote, consistently vote for Democrats.

Who are these voters, and which ones are staying home?
We use the term “Democratic base voters” to refer to left-leaning registered Democrats and Unaffiliated voters who, if they vote, consistently vote for Democrats.
Among all registered voters in the Democratic base in North Carolina, 41% are age 40 or under. Yet voters age 40 and under comprised just 28% of NC voters in 2018 – and 61% of non-voters!
Looking at the Democratic base in North Carolina by race and ethnicity, 54% of all registered Democratic base voters are Black and another 5% are Latinx; only 37% of the total pool is white. Yet, among Democratic base voters who cast ballots in 2018, Black and white voters are almost equally represented at 49% and 44%, respectively. In contrast, among Democratic base voters who stayed home in 2018, only 29% are white, while more than double that portion – 60% – are Black.

The magnitude of the over-representation of left-leaners – especially young, Black, and Latinx voters – in the pool of registered voters who did not vote in 2016 or 2018 that we find for North Carolina is highly consistent with the patterns documented nationally in this Pew Research study.
WINNING NORTH CAROLINA IN 2020
The current political environment in the United States is more polarized than at any other time in recent history. As the number of true swing voters shrinks, winning elections in this hyper-partisan era generally comes down to which side is better able to turn out its base. This pattern favors Republicans in low-stakes, low-turnout elections, because the Republican base, while smaller than the Democratic base, votes much more reliably.
The good news for Democrats is that the 2020 election is shaping up to be one of the highest-stakes, highest-turnout elections of our lifetimes. Interest in the election is already off the charts, with voters following the election closely and expressing an enthusiasm to vote at rates we usually do not see until the final weeks before Election Day.
In this election environment, NC Democrats have an enormous opportunity to win critical races up and down the ballot by pursuing a base-turnout strategy that taps into the huge pool of low-propensity, left-leaning voters who stayed home in 2016 and 2018.
Republicans have been executing this strategy for years; yet it’s been a winning strategy for the NC GOP only because Democratic base turnout doesn’t keep up in most years. With a much larger base to draw on and interest in the election already at a fever pitch, Democrats have a real opportunity to win big across North Carolina in 2020, and it all comes down to this: if we turn out, we win.